This builds from previous posts about the Surgical Learning Curve in Robotic Assisted Surgery. For an intro on the background, data, and various definitions, see this post. Additionally, see here for my first post describing the work of modeling these learning curves as well as important applications of these models in quantifying surgical efficiency and surgeon proficiency.
Influencing the Curve
Surgeons who perform procedures more often outperform surgeons that complete the same number of procedures less often (more days between cases)
Analysis of the learning curve model for various cohorts of Surgeons can help identify specific drivers of increased performance. For example, the following exploratory visualization (figure 1) provides support to the hypothesis that Surgeons who perform procedures more often outperform surgeons that complete the same number of procedures less often (more days between cases). The performance indicator in this case is overall procedure duration. In figure 1 below, the frequency difference between groups is identified empirically using the top and bottom 25th percentile in the total number of days between cases.1 This observation is seen across all 6 procedure types indicated in the plot below.
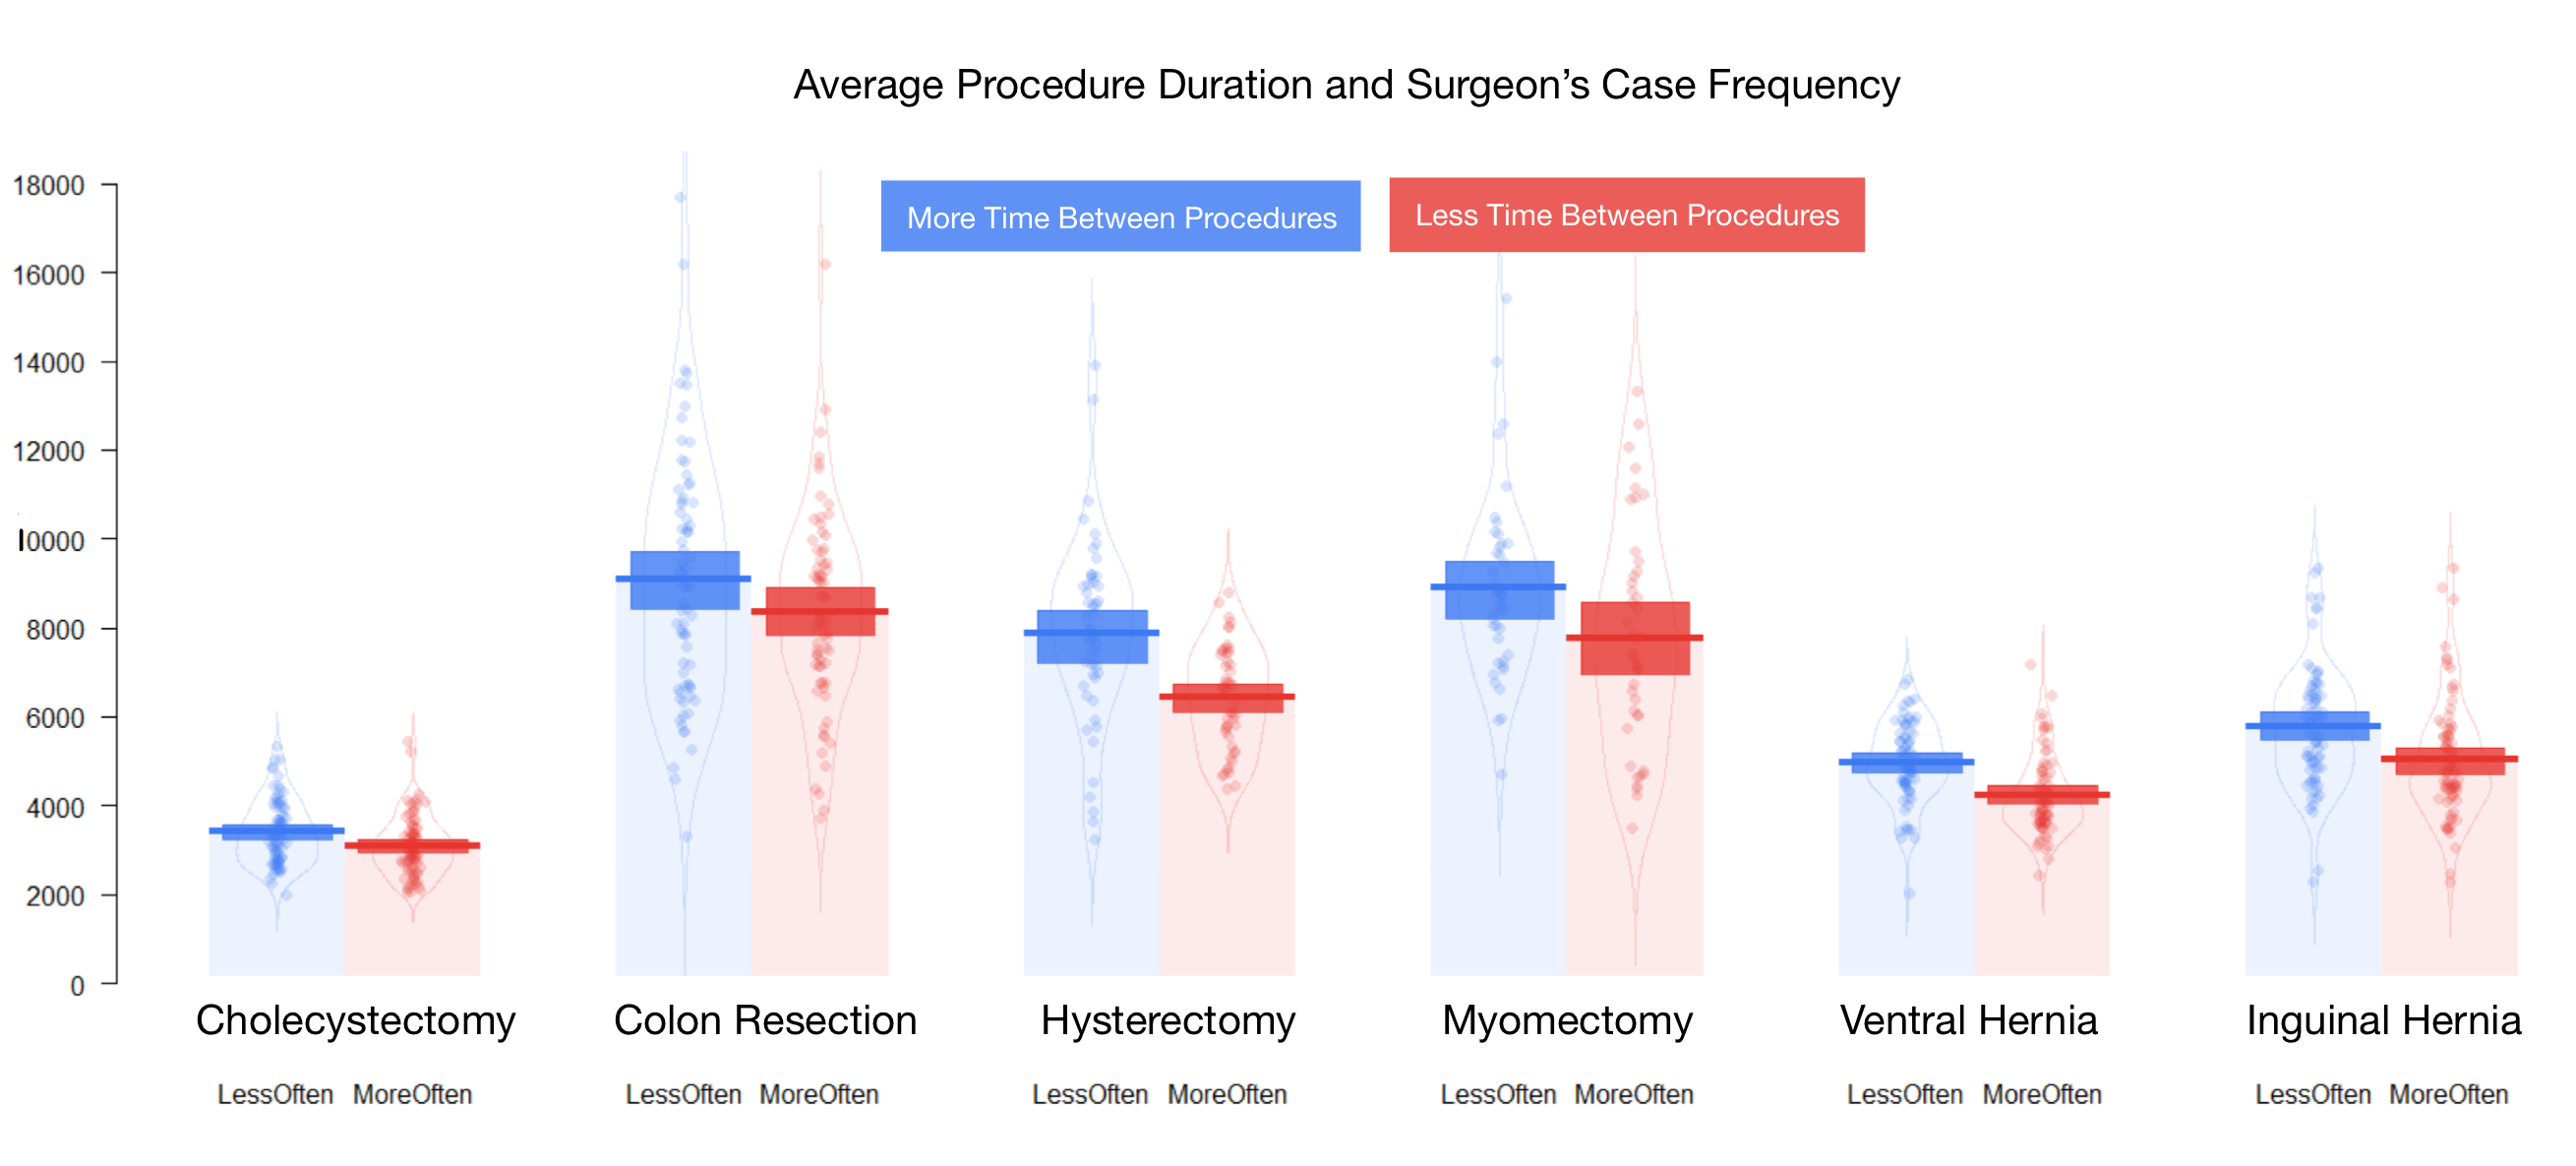
Figure 1 above shows the difference in Average Procedure Duration across groups of surgeons that were classified as performing 100 total procedures more frequently (the top 70th percentile in time taken to perform 100 total cases) vs less frequently (bottom 30th percentile). By controlling for total cases performed across groups, we can capture the true impact that frequency has on the learning curve outcome measure used (procedure duration).
Actionable Learning Indicators (Levers of Learning)
The following variables have been studied and demonstrated to have a significant impact on the learning curve. These are referred to as Levers of Learning.
- Case Mix: captures effects attributed to general complexity, degree of specialization, and transferred background learning. Case Mix best accounts for procedure agnostic learning that can be transferred across a series of different cases that a given surgeon performs
- Case Frequency:captures the effect on expected efficiency that is largely attributed to the time between subsequent cases. Empirical observations of robotic surgery data suggest that a large portion of the gain in efficiency that comes from Surgeon learning is the degree of exposure a surgeon has within a fixed period of time
- Procedure Velocity: is a derivation of Case Frequency; however, the interpretation of Velocity is not based on exposure within a fixed period of time. Rather, Velocity is expressed as a point-in-time measure of the degree of case exposure, for all historical cases through most recent observation.2
Benchmarking with Baseline Learning Curve
The result demonstrates that if surgeons perform cases more frequently as they continue gaining experience, then they actually shift to a more desirable learning curve.
The following illustrates a baseline learning curve modeled using Robotic Surgery data across a number of procedure types. Furthermore, we can adjust model parameters to understand its impact on the learning trajectory. The top most learning curve in figure 2 is the baseline expected trajectory of procedure duration through a surgeons first 100 cases. From there, we show new learning curves assuming greater and greater case frequency scenarios. The result demonstrates that if surgeons perform cases more frequently as they continue gaining experience, then they actually shift to a more desirable learning curve.

Footnotes
Surgeon in the ‘less often’ group have an average count of days between cases that falls in the top 25th percentile (more days).↩︎
More simply, Velocity is calculated as the cumulative average procedures per-day for a surgeon and expressed at a specific case N, while Frequency is a simple average associated with a period (e.g. between cases 10 and 20).↩︎